
In statistics, standard deviation is a measure of how spread out data is. It’s calculated as the square root of variance. Standard deviation is used to describe the distribution of data.
In this post, we will learn the basics of the standard deviation along with its definition, types, formulas, and calculations.
What Is Standard Deviation?
Standard deviation is a statistical measurement of how dispersed a data set is from its mean. This can be helpful in understanding the variability of a data set, and in making decisions based on this information. Standard deviation can be represented by the sigma symbol (σ).
Standard deviation is a statistical measure of variability. It is used to calculate how spread out the data in a sample or population is from the average. There are two types of data in standard deviation: the standard deviation for samples and the standard deviation for populations.
Standard deviation is also important when it comes to tracking things like weather patterns or performance data for athletes. Weather forecasters use it to predict the likelihood of different types of storms and athletes use it to see how their performances compare to others in their league.
Another benefit of standard deviation is that it can provide insight into variability. For example, if you have data that includes both high and low values, then the standard deviation will show you how much variation there is between these values. This information can be helpful in making decisions, such as when to invest money or when to make hiring decisions.
Types of standard deviation
There are two types of standard deviation: sample standard deviation and population standard deviation.
Sample standard deviation is used to measure the variability of individual data points within a sample. Population standard deviation is used to measure the variability of data points across an entire population.
It’s important to note that these two types of standard deviations aren’t always equal; for example, sample standard deviation might be larger than population standard deviation if there are more outliers in the sample than in the population.
What’s the difference between population standard deviation and sample standard deviation?
Standard deviation is a measure of how spread out numbers are. The population standard deviation measures the variability within a population. It tells you how many numbers in the population are far away from the average, and it gives an idea of how much variation there is within the population.
The sample standard deviation measures the variability within a sample. It tells you how many numbers in a sample are far away from the average, and it gives an idea of how much variation there is within that group of samples.
It’s often used to calculate outliers in data sets. For example, if you have data set with 100 numbers and your sample has 10 outliers (i.e., values that are far away from the rest of the data), then your sample standard deviation would be 10/100 or 0.1.
One important difference between population standard deviation and sample standard deviation is that the population standard deviation measures the variability within a population, while the sample standard deviation measures the variability within a sample.
Also, check out ml to grams calculator
Formulas of standard deviation
Here are the formulas of standard deviation.
For sample standard deviation
s = √ [∑ (xi – x̄)2 / (n – 1)]
For population standard deviation
σ = √ [∑ (xi – µ)2 / n]
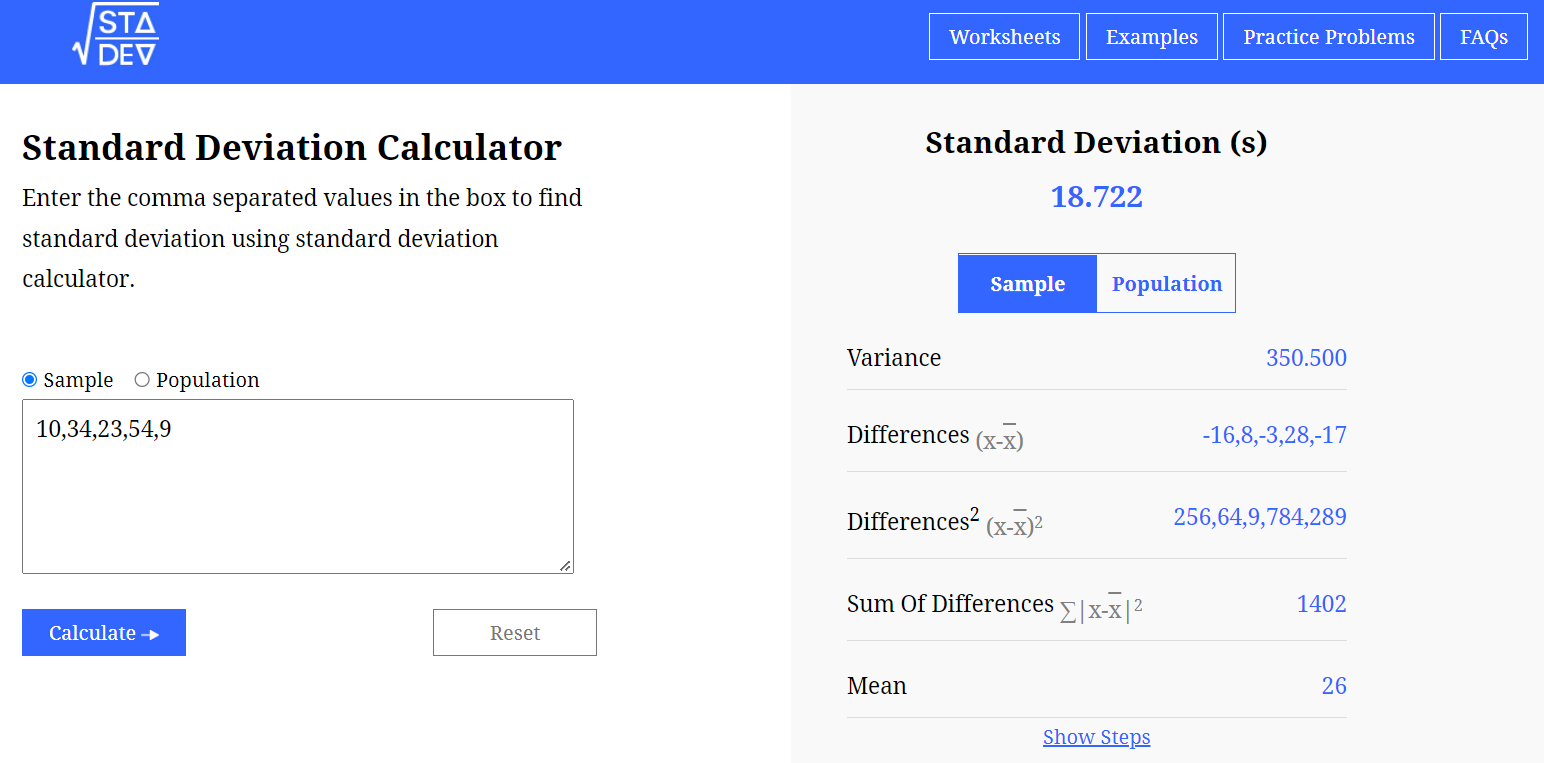
A standard deviation calculator can be used to solve the problems of sample and population standard deviation according to their formulas to avoid lengthy calculations.
How to calculate the standard deviation?
Let us take a few examples of standard deviation to learn how to calculate it manually.
Example 1: for sample data
Measure the variability of the given set of sample data.
2, 8, 12, 13, 15, 16, 19, 22, 24, 25, 26, 28
Solution
Step 1: First of all, take the given sample data and evaluate the sample mean.
Sample data = 2, 8, 12, 13, 15, 16, 19, 22, 24, 25, 26, 28
Sum = 2 + 8 + 12 + 13 + 15 + 16 + 19 + 22 + 24 + 25 + 26 + 28
Sum = 210
Total number of observation = N = 12
Sample Mean = x̄ = 210/12
Sample Mean = x̄ = 105/6 = 17.5
Step 2: Now calculate the difference of sample data observations from the sample mean and calculate the square of differences.
| Data values | xi – x̄ | (xi – x̄)2 |
| 2 | 2 – 17.5 = -15.5 | (-15.5)2 = 224.25 |
| 8 | 8 – 17.5 = -9.5 | (-9.5)2 = 90.25 |
| 12 | 12 – 17.5 = -5.5 | (-5.5)2 = 30.25 |
| 13 | 13 – 17.5 = -4.5 | (-4.5)2 = 20.25 |
| 15 | 15 – 17.5 = -2.5 | (-2.5)2 = 6.25 |
| 16 | 16 – 17.5 = -1.5 | (-1.5)2 = 2.25 |
| 19 | 19 – 17.5 = 1.5 | (1.5)2 = 2.25 |
| 22 | 22 – 17.5 = 4.5 | (4.5)2 = 20.25 |
| 24 | 24 – 17.5 = 6.5 | (6.5)2 = 42.25 |
| 25 | 25 – 17.5 = 7.5 | (7.5)2 = 56.25 |
| 26 | 26 – 17.5 = 8.5 | (8.5)2 = 72.25 |
| 28 | 28 – 17.5 = 10.5 | (10.5)2 = 110.25 |
Step 3: Now calculate the sum of square of differences.
∑ (xi – x̄)2 = 240.25 + 90.25 + 30.25 + 20.25 + 6.25 + 2.25 + 2.25 + 20.25 + 42.25 + 56.25 + 72.25 + 110.25
∑ (xi – x̄)2 = 693
Step 4: Now divide sum of squared terms by the degree of freedom (n-1).
∑ (xi – x̄)2 / (n – 1) = 693 / 12 – 1
∑ (xi – x̄)2 / (n – 1) = 693 / 11
∑ (xi – x̄)2 / (n – 1) = 63
Step 5: Now to calculate the sample standard deviation, take the square root of the above result.
√[∑ (xi – x̄)2 / (n – 1)] = √63
√[∑ (xi – x̄)2 / (n – 1)] = 7.94
Example 2: for population data
Measure the variability of the given set of population data.
5, 10, 20, 25, 28, 30, 32, 34
Solution
Step 1: First of all, take the given population data and evaluate the population mean.
Population data = 5, 10, 20, 25, 28, 30, 32, 34
Sum = 5 + 10 + 20 + 25 + 28 + 30 + 32 + 34
Sum = 184
Total number of observation = n = 8
Population Mean = µ = 184/8
Population Mean = µ = 92/4 = 46/2 = 23
Step 2: Now calculate the difference of population data observations from the population mean and calculate the square of differences.
| Data values | xi – µ | (xi – µ)2 |
| 5 | 5 – 23 = -18 | (-18)2 = 324 |
| 10 | 10 – 23 = -13 | (-13)2 = 169 |
| 20 | 20 – 23 = -3 | (-3)2 = 9 |
| 25 | 25 – 23 = 2 | (2)2 = 4 |
| 28 | 28 – 23 = 5 | (5)2 = 25 |
| 30 | 30 – 23 = 7 | (7)2 = 49 |
| 32 | 32 – 23 = 9 | (9)2 = 81 |
| 34 | 34 – 23 = 11 | (11)2 = 121 |
Step 3: Now calculate the sum of square of differences.
∑ (xi – µ)2 = 324 + 169 + 9 + 4 + 25 + 49 + 81 + 121
∑ (xi – µ)2 = 782
Step 4: Now divide sum of squared terms by the total number of observations (n).
∑ (xi – µ)2 / N = 782 / 8
∑ (xi – µ)2 / N = 391 / 4
∑ (xi – µ)2 / N = 97.75
Step 5: Now to calculate the population standard deviation, take the square root of the above result.
√[∑ (xi – µ)2 / N] = √97.75
√[∑ (xi – µ)2 / N] = 9.89
Wrap up
Standard deviation is an important statistical technique that measures how dispersed a data set is from its mean. It’s used to understand the variability of data, and make decisions based on this information. You can grab all these basics from this post.